The Development of Planetary Stock Market Forecasting By Bill Meridian I can best explain this development in market analysis through my own
experience. I became interested in the stock market in the late sixties by reading
the Edwards and Magee and the Jiler books on technical analysis. Pattern
perception, valuable as it is, usually does not tell the trader when a
pattern will conclude or will manifest. In the seventies, Hurst wrote a
book about the application of cycles to assist in this task. This led me
to an interest in cycles. A study of market cycles that had been isolated
by the Foundation for the Study of Cycles demonstrated that some of the
stock market rhythms were the same length as those of planetary periods,
so I began to analyze the relationship between prices and planets. In the
late 1970s, a computer program was designed for this purpose; the work
was born on Lotus spreadsheets in the early 1980s. The first program created
specifically for this purpose came on line in 1986. INDIVIDUAL PHENOMENAIndividual
phenomena may enable one to zero in on specific
days of top or bottom. Phenomenon includes angles
between planets (aspects) as they move through
space, new and full moons, eclipses, etc. These
are separate from cycles, which are described
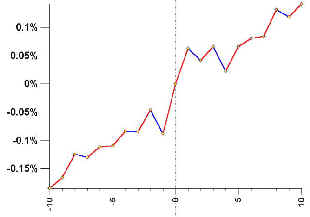
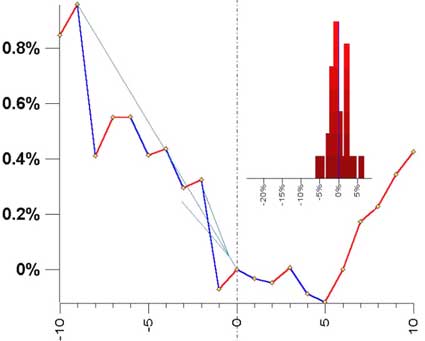
below. The greater value lies in reinforcement, wherein several events occur very near in time that has the same or a similar effect on the price series. Thus, if three events that are all coincident with tops occur on the same day, we have a high-probability potential high. I can make the same observation about potential lows. When there are no phenomena that are correlated to the market, then prices tend to move in one direction. When there are conflicting phenomena, the market tends to trade back and forth. CYCLESA full cycle would be that described, for example, by the lunar rhythm. If one calculates the market’s movement from new moon to new moon over 28 or 29 days, we have a complete cycle. The most understandable cycle is the annual cycle in the US stock market. All traders know of the traditional summer rally followed by autumn weakness, etc. The calendar is determined by the position of the Sun, so this cycle is the solar cycle. READING THE GRAPHS The graphs depict a planetary event at zero on the horizontal axis. This axis represents time in the days before and after the event. The vertical axis is the average percentage change in the Dow Jones Industrial Average from 1915 to 2002. Thus, a line up from 5 days before an event until the day of the event from -0.5% to +0.5% is an average move of 1%. If the Dow were at 10,000, then this would be a move of 100 points over 2 days. COMBINATIONS FOR FORECASTING The ideal situation would be to have several events that have historically been associated with tops occurring close in time while a relevant cycle also tops. This set-up then only needs to be confirmed with technical indicators to identify a trading opportunity. Graph 1 depicts Sun-Mercury conjunctions (zero degrees between the two planets) versus the Dow from 1915 to the present. Note that the market tends to make minor highs. These are not reliable enough to trade profitably. The market is usually up from 1 day prior to the aspect until 1 day after about 56% of the time. Then a drop ensues from 1 day after until 4 days after 53% of the time, but the magnitude is small: 0.25%. Over any 3 day period the Dow rises, on average, about 54% of the time.
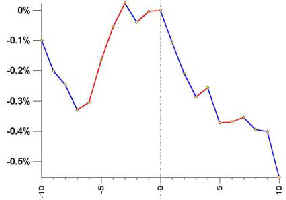
The zodiacal sign acts as the great modulator. The reaction of the market depends upon the sign in which the aspect takes place. Graph 2 depicts the Sun moving into the sign of Aries and the subsequent short-term decline in the Dow. Note that this can only occur on March 20 of every year. The Dow has dropped 55 of 88 times (63%) from the day of the entry until 5 days later. The resultant Dow drop is only 0.35%.
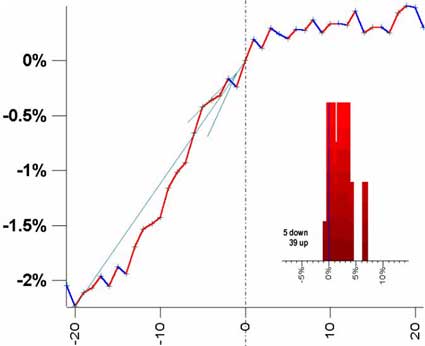
The value lies in Sun-Mercury conjunctions near zero degrees of Aries. In this case, the effect on the market is the combination of both as it occurred last on March 19,1999, followed by a 4% drop in the following week. If we allow a 3-day (or degree) orb around 0 Aries or March 20, there have been 11 such conjunctions near 0 Aries. Nine have been followed by Dow declines of from 1.5% to 4%. One, in 1970, was near a low, with the Dow rising 2.5% in the next week. In 1979, the market was flat over the next week. Thus 9 of 11 have led to tradable drops in the Dow. The next one occurs on March 22,2003. This is the principle of reinforcement. Frequently, one aspect alone will not move the market enough to generate a profit. In this case, the declining effect of the aspect is enhanced by the falling influence of the solar cycle. Here are more examples of the better indicators. About every 2 years, there is a Sun-Mercury conjunction in the sign of Capricorn (graph 3). The market has risen in the 20 days before the aspect until the day of the aspect by an average of 2.5% about 89% of the time (39 of 44 times). This indicator was discovered by Ed Dewey, the founder of the Foundation for the Study of Cycles. It can only occur between December 21 and January 19 each year. To provide better perspective, the market is usually strong during that time of the year, but it is stronger when this aspect occurs. The next one occurs on January 11, 2003
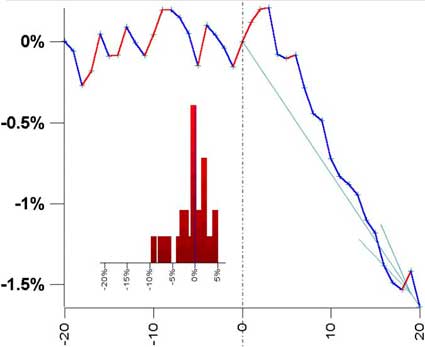
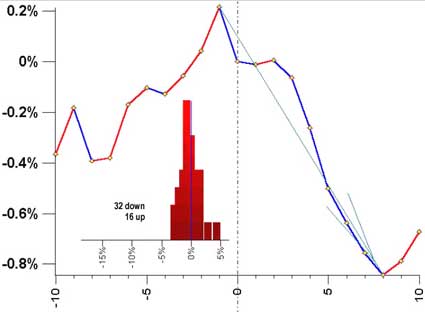
There are two more Sun-Mercury conjunctions (graph 4) that have value as potential turning points. The first is the one that takes place in Virgo, usually near tops. It can only happen between August 23 and September 21 annually. If the conjunction occurs in late August or early September, the following decline can be substantial as the September monthly weakness kicks in. The tendency is for the market to fall 61% of the time from the day of the conjunction to 20 days later. The average fall is 1.6%. The next one is on September 11, 2003.
The next is
associated with lows. It is the Sun-Mercury
conjunction in Scorpio (graph 5).
The Mars-Pluto conjunction (graph 6) occurs about every 1.8 years. This aspect is a harbinger of tops. The market has fallen from 1 day before to 8 days after this aspect 75% of the time. The average drop has been 1%. The next Mars-Pluto conjunction takes place on February 16, 2003. To extend this example further, we take into consideration the sign that the Sun occupies at the time of the aspect. We find that the effect is greatly mitigated if the Sun is in a fire sign. It is greatly enhanced when the Sun is in an earth sign; the average drop doubles to 2% when the Sun is in water signs, the effect is about the same, but the batting average increases to 11 out of 12 times, 92%. When the Sun is in an air sign as it will be when the next Mars-Pluto conjunction occurs, the effect is about the same as the average depicted in graph 6.
THE KEY TO SUCCESS IS TO FIND THE RIGHT COMBINATION The presence of a large number of planetary indicators is not necessarily enough to move a market. There have been periods when large configurations of stressful combinations have appeared in space. However, after analyzing the components of these configurations on a piece-by-piece basis as I have done above, the net effect was zero. That is, 4 were bullish, 4 were bearish, and some had no effect on stocks. The result was a volatile week that ended close to where it began. The key to the identification of high-probability turning points is to isolate several phenomena in a tight time span. The maximum effect will be gained if a cycle is also reinforcing the effect of the indicators. In this brief article, the solar cycle was utilized. As this time period approaches, confirm the signal with technical indicators. In this brief article, I have explained the basics of such analysis and have introduced several high-probability planetary indicators. |