The
strongest
period for
the US
stock
market is
the
stretch
from
October to
April. In
fact,
since
1988, the
single
strongest
grouping
that
period has
been the
semiconductor
industry.
Could
there be
an
astronomic
correspondent
to this
phenomena?
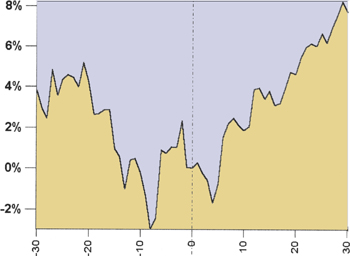
The planet Uranus has been making its stations in the spring and in the fall. I tested this relationship.
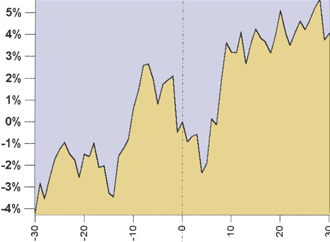
The lines represent the percentage change in the index from 30 days before to 30 days after the station. Note that the SOXX tends to drop about 5% from 8 days before the station to 3 days after the station. There is a general tendency to fall before the station and to a mild tendency to rally after.
|
|
| Graph
1: Retrograde Stations of Uranus Versus the Semiconductor (SOXX) Index 1995–2000 |
 |
 |
Graph
2:
Direct Stations of Uranus Versus the Semiconductor (SOXX) Index 1995–2000 Graph
2
reveals
the
tendency
to decline
before and
to
strongly
rally
after the
direct
station.
This
station in
the autumn
is the
major
propellant
for this
semiconductor
phenomena. |
|
Graph
3:
Semiconductor
Index
(SOXX)
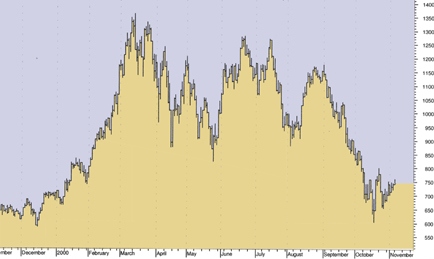
Graph 3 depicts the SOXX average for the last half of 2000. Note that the group bottomed on October 19 with the rest of the market, but the group also pulled back on the 26th, the day of the direct Uranus station. At the time this writing in November of 2000, I expect this group to rally into January. The Uranus station was one indicator that was instrumental in expecting a low. |
|
To
take the
analysis
one step
further,
the group
average is
a
composite
of the
prices of
key
semiconductor
stocks.
One key
component
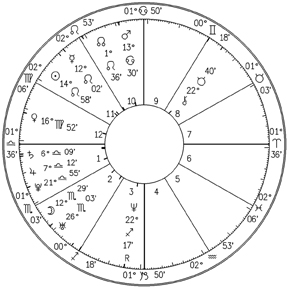
is Intel (INTC).
Below is
the
horoscope
of first
trade.
Note the
position
of the Sun
at 15 Leo,
opposite
the autumn
2000
station of
Uranus at
16
Aquarius.
This solar
position
also tied
into the
picture,
creating
more
volatility
than
usual.
INTC took
a big hit
in
October,
leading
the tech
group
down. The
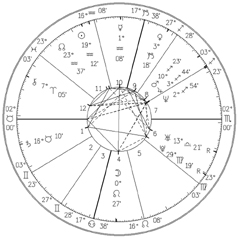
chart for
the
opening
day of the
NASDAQ is
also tied
in. Note
that the
station
(and the
eclipse of
the
previous
February)
applying
closely to
the Sun
and
squaring
Saturn.
|
|
|
|
Intel
Intel was first traded August 7, 1981 at 10AM EDT in New York, NY. |
| NASDAQ
NASDAQ begins trading Feb.8, 1971; 0 AM EST. |
|